Thursday, December 20, 2012

GLD new Dec month trade, Dec/20/2012

Trade closed at expiry
Sold for 80c for 220% profit
________________________________________________________

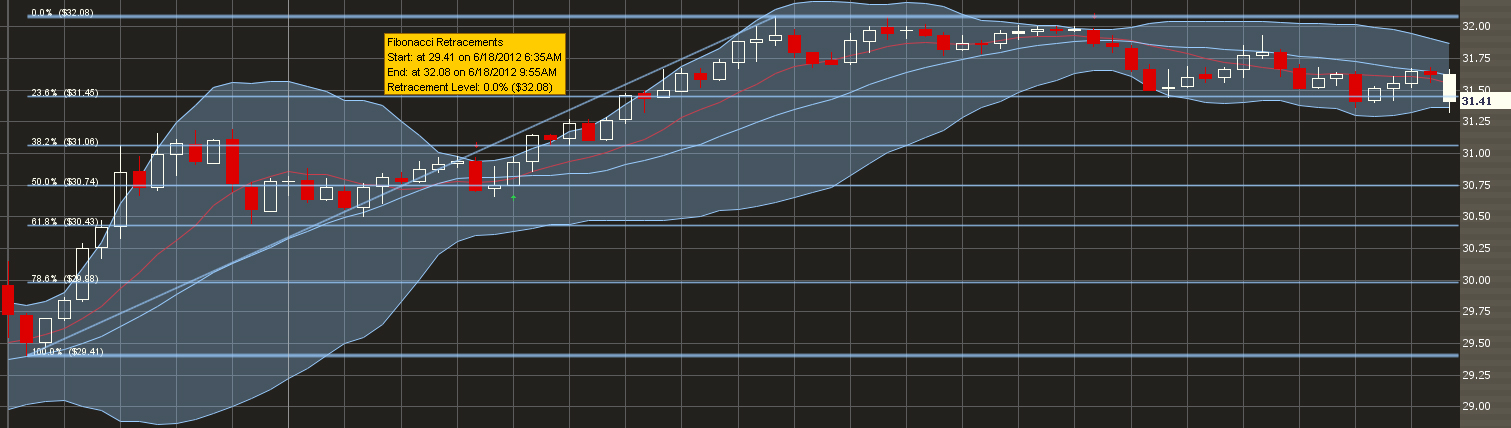
GLD slipped in the last few days. I won't buy any puts in here for weekly nor I am expecting a big bounce. With slightly higher vol one thing that comes to my mind is a butterfly to pin 160 with high open int at 160 strikes.


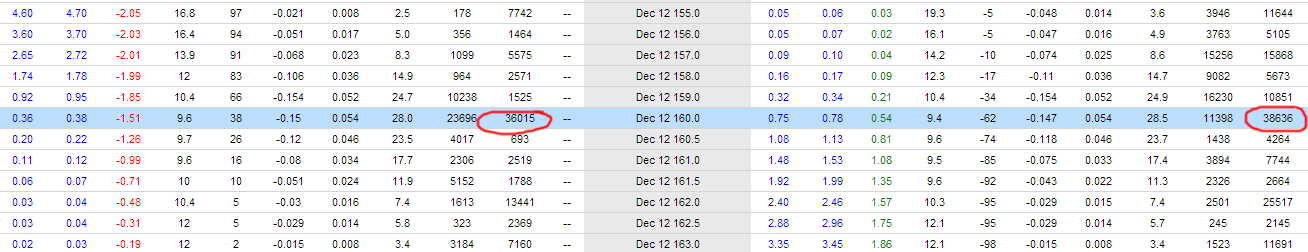
GLD high open int for $160 strikes


GLD daily


SPDR Gold Trust ETF (GLD) Butterfly:  
Buy 1X $159 Dec call
Sell 2X $160 Dec call
Buy 1X $161 Dec call
(Paid 25c) 

*Please do your own research before buying any stock listed here. Disclaimer.
>> Subscribe to our posts.

Friday, November 30, 2012

CMG new Dec month trade, Dec/142012

Waiting for CMG to drop by $10 or so. I think the surprise move here may be to the upside so do not want to to risk a lot of money. I thought butterfly was a cheaper way to play the downside here. Trying to make a double or more if CMG slips.


CMG Daily chart


Chipotle Mexican Grill, Inc. (CMG) Butterfly:  
Buy 1X $270 Dec put
Sell 2X $260 Dec put
Buy 1X $250 Dec put
(Paid 90c) 

*Please do your own research before buying any stock listed here. Disclaimer.
>> Subscribe to our posts.

Thursday, November 29, 2012

ANF new Dec month trade, Nov/29/2012

It's tough to short a stock that is overbought but I think ANF is almost approaching a point where it is finding hard to go any higher. One can see dissipating upward pressure in daily and weekly charts. I do not see ANF going under $40 so if it goes in my direction in the next few days, I will try to convert this into some logical spread.
Daily chart


Weekly chart


Abercrombie & Fitch Co. (ANF) Puts:  
Buy $45 Dec put
(Paid $1.3) 

*Please do your own research before buying any stock listed here. Disclaimer.
>> Subscribe to our posts.

Tuesday, November 20, 2012

SPX analysis, no new trades, Nov/20/2012

Watching for the SPX to start rolling down again after VIX expiry on Wednesday. One can see how TLT is down 1% for the day which might bring a little rally tomorrow and possibly on friday. I will be looking to enter some short positions tomorrow and friday to see if we hold these higher levels. VIX is at good levels right now and I am ready to buy dips here under $15 level. Looking to get in SPX put spreads and VIX call spread, while I play my other short term positions.

SPX daily chart

SPX daily chart showing a possible down-trend to continue

TLT daily chart supporting SPX

VIX daily chart


*Please do your own research before buying any stock listed here. Disclaimer.
>> Subscribe to our posts.

Friday, November 16, 2012

GLD new Dec month trade, Nov/16/2012

Expired worthless for 100% profit
________________________________________________________

Actually took this trade 2/3 days back when GLD volatility was slightly higher.

SPDR Gold Trust ETF (GLD) Iron Condor:  
Buy 1X $155 Dec put
Sell 1X $157 Dec put
Sell 1X $174 Dec call
Buy 1X $176 Dec call

(Got 53c) 

*Please do your own research before buying any stock listed here. Disclaimer.
>> Subscribe to our posts.

VMW entire trade closed, Nov/16/2012

Trade update (Nov/16/2012):
Sold the remaining half for $1.75 for approx 550% profit
________________________________________________________
Original post details here

Tuesday, November 13, 2012

VMW trade closed

Trade update (Nov/13/2012):
Sold half for 65c for 140% profit
________________________________________________________
details here

Thursday, November 8, 2012

AAPL new Weekly trade, Nov/08/2012

Trade update (Nov/09/2012):
Expired worthless for 100% profit
________________________________________________________

For Apple, 525 range is almost like a 2 standard deviation move for the weekly. I wanted to take this opportunity to sell some naked puts. It does take a lot of margin and is extremely risky, but I like the odds here. My stop at $2 in case this goes sharply against.

Apple inc (AAPL) Naked sell:  
Sell 1X $530 Weekly put
(Got $1.25) 

*Please do your own research before buying any stock listed here. Disclaimer.
>> Subscribe to our posts.

Monday, November 5, 2012

VVUS new Nov Monthly trade, Nov/05/2012

Didn't want to fight oversold VVUS, so thought selling puts may be a little better here. I know it's not the best trade, but I liked the credit I was getting and the room I get to be wrong in this trade.

VVUS daily chart


VIVUS, Inc. (VVUS) Credit vertical:  
Sell 1X $14 Nov put
Buy 1X $13 Nov put
(Got 40c) 

*Please do your own research before buying any stock listed here. Disclaimer.
>> Subscribe to our posts.

AAPL new Nov Monthly trade, Nov/05/2012

Trade update (Nov/06/2012):
Looked scary and covered for 80c for 20% profit
________________________________________________________

Apple Inc. (AAPL) Credit vertical:  
Sell 1X $555 Nov put
Buy 1X $550 Nov put
(Got $1)

AAPL daily chart


Looking for a test of 200-day moving average in Apple. Went too far in the strikes to give myself enough room to exit if it goes against. In a perfect case, I would like to convert this into an iron condor if we hit $600 in the next few days.


*Please do your own research before buying any stock listed here. Disclaimer.
>> Subscribe to our posts.

Thursday, November 1, 2012

AAPL new weekly trade, Nov/01/2012

Trade update (Nov/02/2012):
Expired worthless for 100% loss
________________________________________________________

Apple Inc. (AAPL) Butterfly for debit: 
Buy 1X $590 Weekly call
Sell 2X $600 Weekly call
Buy 1X $605 Weekly call 
(Paid $1)

*Please do your own research before buying any stock listed here. Disclaimer.
>> Subscribe to our posts.

SBUX PCLN LNKD earnings trade, Nov/01/2012

Trade update (Nov/02/2012):
Trade-1 SBUX: Closed for 15c for 42% loss
Trade-2 PCLN: Expired worthless for  100% profit
Trade-3 PCLN: Closed for 5c for almost 100% loss
Trade-2 LNKD: Expired worthless for  100% profit
________________________________________________________

There's high volatility in all these stocks and we want to eat premiums from atleast the weeklies. Here are some trades we are taking today.

Starbucks Corporation (SBUX) Trade for debit: 
Buy 1X $48 Monthly call 
Sell 1X $48 Weekly call
(Paid 26c)

Priceline.com Inc (PCLN) Iron Condor for credit: 
Buy 1X $655 Weekly call 
Sell 1X $650 Weekly call
Sell 1X $500 Weekly put
Buy 1X $495 Weekly put
(Got 80c) 

Priceline.com Inc (PCLN) Butterfly for debit: 
Buy 1X $590 Weekly call
Sell 2X $600 Weekly call
Buy 1X $605 Weekly call 
(Paid 75c) 
I like the risk reward in this, trying to make 9.25, risking 0.75. 

Linkedin (LNKD) Iron Condor for Credit: 
Buy 1X $120 Weekly call 
Sell 1X $115 Weekly call
Sell 1X $95 Weekly put
Buy 1X $90 Weekly put
(Got a credit of $1.75) 

*Please do your own research before buying any stock listed here. Disclaimer.
>> Subscribe to our posts.

Thursday, October 25, 2012

AAPL & AMZN earnings trade, Oct/25/2012

Trade update (Oct/26/2012):
Perfect trades. All winners here!
Trade-1: Expired worthless for  100% of credit profit
Trade-2: Closed for $4 for  100% profit
Trade-3: Expired worthless for  100% of credit profit
________________________________________________________

Iron condors work great with high volatility scenarios like we are seeing now in AAPL and AMZN and the overall markets. In AMZN I did another trade where I eat premium from the weekly and get long the Nov calls. Here are some trades we took today.

AMZN Trade-1 (CREDIT): 
Buy 1X $260 Weekly call 
Sell 1X $255 Weekly call
Sell 1X $200 Weekly put
Buy 1X $195 Weekly put
(Got a credit of $1.05)

AMZN Trade-2 (DEBIT): 
Sell 1X $245 Weekly call
Buy 1X $245 Nov Monthly call 
(Paid $2) 

AAPL Trade-1 (CREDIT): 
Buy 1X $660 Weekly call 
Sell 1X $655 Weekly call
Sell 1X $570 Weekly put
Buy 1X $565 Weekly put
(Got a credit of $1.2) 

*Please do your own research before buying any stock listed here. Disclaimer.
>> Subscribe to our posts.

Wednesday, October 24, 2012

NSM and the volatility play closed, Oct/24/2012

I got in NSM seeing exceptionally high volatility in the last 2-3 weeks. Got the upper legs first, then got the lower legs when I thought it was climbing higher. After a scary dip today, I saw the crush in volatility and thought this was the right time to exit the trade. Closed first trade for 10c, then the second trade for $1. Overall almost 92% profit in the first trade, and approx 16% profit in the second

NSM daily chart showing Volatility crash (light blue line)


Trades: 
Sell 1X $40 Nov call
Buy 1X $45 Nov call 
(Got a credit of $1.25)

 Sell 1X $30 Nov put
Buy 1X $25 Nov put 
(Got a credit of $1.2)

*Please do your own research before buying any stock listed here. Disclaimer.
>> Subscribe to our posts.

BBY new monthly trade, Oct/24/2012

Trade update (Oct/26/2012):
Trade-1: Closed for 31c for 33% loss
Trade-2: Closed for 51c for  30% of max credit loss
Not bad at all when stock moved 7-8% against our direction.
________________________________________________________

BBY reports earnings after Nov expiry (Nov/20). I like the trade where we can make money if it stays over $17 by Nov/17.


BBY Weekly chart


Trade-1 (DEBIT): 
Buy 1X $16 Nov call 
Sell 1X $17 Nov call
(Paid 46c)

Trade-2 (CREDIT): 
Sell 1X $16 Nov put
Buy 1X $15 Nov put
(Got a credit of 30c) 

*Please do your own research before buying any stock listed here. Disclaimer.
>> Subscribe to our posts.

Tuesday, October 23, 2012

VMW new monthly trade, Oct/23/2012

Trade update (Nov/13/2012):
Sold half for 65c for 140% profit
________________________________________________________

VMW reports earnings today after close and looking at the weekly chart below, I liked the idea of VMW staying above the lows for a few days/weeks. Looking at the declining markets and VMW at it's lows I thought there are good chances VMW might get pinned to $85 for the month.Although I liked the 80/85/90 butterfly safer and attractive too, I went ahead with 82.5/85/87.5 butterfly looking at a very skewed risk/reward potential as shown in the two images below.

VMW Weekly chart


Risk/Reward with current Implied Volatility
 
Risk/Reward with assumed lower Implied Volatility for the expiry


Trade: 
Buy 1X $82.5 Nov call 
Sell 2X $85 Nov call
Buy 1X $87.5 Nov call 
(Paid 27c)

*Please do your own research before buying any stock listed here. Disclaimer.
>> Subscribe to our posts.

INTC new monthly trade, Oct/23/2012

Trade update (Nov/02/2012):
Closed for 80c at close for  80% profit
________________________________________________________

INTC earnings are over and I think we have a good chance we hit 22 to 23 easily in the next few weeks (in that case I sell this spread I got below). INTC hasn't gone down much considering the downside action in the markets and I liked that sign in this stock.


INTC weekly chart


Trade: 
Buy 1X $21 Nov call 
Sell 1X $22 Nov call 
(Paid 44c)

*Please do your own research before buying any stock listed here. Disclaimer.
>> Subscribe to our posts.

Friday, October 19, 2012

SDS new trade, Oct/19/2012

Trade update (Oct/24/2012)
Closed the upper legs for 83c (I paid 55c if I break the trade shown below) for  51% profit
________________________________________________________

I want to play a possible sharp decline in the markets in the coming weeks and I thought SDS might be a good bet to get in as a hedge as I continue to play any weeklies to the upside (if I plan to).

SPX weekly chart


Trade: 
Sell 1X $53 Dec puts
Buy 1X $51 Dec puts
Sell 1X $57 Dec calls
Buy 1X $55 Dec calls
(Got a total credit of 45c; $1 for credit of puts, 55c debit for calls)

*Please do your own research before buying any stock listed here. Disclaimer.
>> Subscribe to our posts.

Thursday, October 18, 2012

RIG new weekly trade, Oct/18/2012

Trade update (Oct/19/2012):
Closed for 6c at close for  80% of credit profit
________________________________________________________

I think RIG has gone up too much for the week and would like to sell premium at these levels.For 1 day left in expiry I don't think this one is bad.

Trade:
Sell 1X $48.5 Weekly call
Buy 1X $49.5 Weekly call (for protection)
(Got a credit of 30c)

*Please do your own research before buying any stock listed here. Disclaimer.
>> Subscribe to our posts.

NASDAQ trend, Oct/18/2012

NASDAQ daily chart


Nasdaq showing a cleaner trend to the downside. Looking for ways to trade this trend for the next few days. 

*Please do your own research before buying any stock listed here. Disclaimer.
>> Subscribe to our posts.

Wednesday, October 17, 2012

CLF new weekly trade, Oct/17/2012

Trade update (Oct/19/2012):
Expired worthless giving us max of 44c for  100% profit
________________________________________________________

I think CLF has gone up too much for the week and would like to sell premium at these levels. There are more chances that CLF will close below $45 for the week.

Trade:
Sell 1X $45 Weekly call
Buy 1X $46 Weekly call (for protection)
(Got a credit of 44c)

*Please do your own research before buying any stock listed here. Disclaimer.
>> Subscribe to our posts.

Friday, October 12, 2012

SPX S&P watching this support to hold, Oct/12/2012

SPX daily chart


*Please do your own research before buying any stock listed here. Disclaimer.
>> Subscribe to our posts.

Wednesday, October 10, 2012

SCHN, ABX new trades, Oct/10/2012

Trade update (Oct/12/2012):
Closed ABX for 65c for almost  50% of max possible loss

Holding SCHN for OCT expiry.

Trade update (Oct/19/2012):
Expired worthless giving us 35c for 100% Profit.
________________________________________________________

SCHN trade: 
Sell 1X $27 OCT put
Buy 1X $26 OCT put
(Got a credit of 35c)

ABX trade:
Sell 1X $40 Weekly put
Buy 1X $39 Weekly put
(Got a credit of 22c) 

*Please do your own research before buying any stock listed here. Disclaimer.
>> Subscribe to our posts.

AMZN new weekly trade, Oct/10/2012

Trade update (Oct/12/2012):
Closed for $2.5 for almost  28% of max loss
________________________________________________________
AMZN fell below it's one standard deviation move after being such a strong stock in the last few weeks. $245 is in the middle of one standard deviation and two standard deviation and I think there are good chances AMZN will hold 240-245 range for the week, maybe even next week. Volatility is higher which gives some juice to the premium too.

AMZN daily chart showing standard deviation and increasing volatility


Trade:
Sell 1X $245 Weekly put
Buy 1X $240 Weekly put
(Got a credit of $1.5)

*Please do your own research before buying any stock listed here. Disclaimer.
>> Subscribe to our posts.

Friday, October 5, 2012

CMG new trade, Oct/05/2012

Trade update (Oct/18/2012):
Do not want to mess with the earnings so closed this trade for $1.5 for a 25% profit of max profit. I wish it had gone up much higher so I could have convert this one into an iron condor.
________________________________________________________

This one can be a possible earnings play but we will see how it goes in the next week. CMG earnings are due on Oct/18 which falls in Oct expiry. Volatility is high and we like to sell premium on OTM strikes. I think it will be hard for CMG to break down heavily in front of earnings and we might go up soon here considering the uncertain nature of the earnings.

CMG weekly chart


Trade:
Sell 1X $275 Oct put
Buy 1X $270 Oct put
(Got a credit of $2)

In the best case scenario, I would love to convert this one to an iron condor if CMG goes up too high. 

*Please do your own research before buying any stock listed here. Disclaimer.
>> Subscribe to our posts.

SPX new monthly trade, Oct/05/2012

Trade update (Oct/09/2012):

Closed for $4 today morning for  100% profit
________________________________________________________

Wanted to get into SPX trade as we were making a double top and coming down a bit. SPX does look like it's overbought. Usually mondays have been down days recently, I may get out of it on monday or keep it for longer. I wanted to get in as a hedge in case I play some upside moves for the next week.

SPX daily chart (Double top)


Trade:
Buy 1X 1450 Oct put
Sell 1X 1440 Oct put
(paid $2)

*Please do your own research before buying any stock listed here. Disclaimer.
>> Subscribe to our posts.

Monday, October 1, 2012

Amazon.com, AMZN new weekly trade Oct/01/2012

Trade update (Oct/08/2012):

Closed half at $1.2
Closed half at $0.40
Total: 33% profit
_______________________________________________________


Just want AMZN to drop in the blue zone shown in the next 4 days. The momentum can bring it down in our target area and we can easily sell this one for a double or more. If this doesn't work in the next 1-2 days one can get out for 50% loss.

Trade:
Buy 1X $250 weekly put
Sell 2X $245 weekly put 
Buy 1X $240 weekly put
(paid 60c)

*Please do your own research before buying any stock listed here. Disclaimer.
>> Subscribe to our posts.

Facebook Inc, FB new trade Oct/01/2012

Trade update (Oct/10/2012):
Closed for $1.10 today morning for 145% profit
________________________________________________________
FB jump after the big drop from last week seemed a bit suspicious. Playing this put debit spread gives us a few days for us to watch FB's direction. If this doesnt go down in the next few days, we will close out this position.

Trade:
Buy 1X $21 Oct put
Sell 1X $19 Oct put
(paid 45c)

*Please do your own research before buying any stock listed here. Disclaimer.
>> Subscribe to our posts.

IOC, OXY, DRI, LULU credit spreads for sep/28/2012

Trade updates (Oct/08/2012):

Closed IOC for 45c for approx 50% credit profit
Closed OXY for 25c for over 50% credit profit
Closed DRI for 50c for approx 20% profit
LULU expired to give us max profit of 60c for 100% profit
________________________________________________________

IOC
Trade:
Sell $75 weekly put
Buy $72.5 weekly put
(Got 85c credit)

OXY
Trade:
Sell $85 weekly put
Buy $82.5 weekly put
(Got 46c credit)

DRI
Trade:
Sell $55 weekly put
Buy $52.5 weekly put
(Got 60c credit) 

LULU
Trade:
Sell $72.5 weekly put
Buy $70 weekly put
(Got 60c credit)

*Please do your own research before buying any stock listed here. Disclaimer.
>> Subscribe to our posts.

Weekly trade roundup ending sep/28/2012

Roundup of TLT trades for last week:

http://breakout-stocks.blogspot.com/2012/09/tlt-weekly-new-trade-sept242012.html
Let it expire to eat entire premium. Max profit.

http://breakout-stocks.blogspot.com/2012/09/tlt-weekly-new-trade-sept252012.html
Closed the position, paid 20c. 6% profit

*Please do your own research before buying any stock listed here. Disclaimer.
>> Subscribe to our posts.

Wednesday, September 26, 2012

TLT weekly, new trade sept/25/2012

Converted the TLT credit spread from yesterday to an iron condor today.

Trade:
Sell $124.5 weekly call
Buy $126 weekly call
(Got 30c credit)

Now my breakeven is $125.1 on the upside and $120.9 on the lower side.

*Please do your own research before buying any stock listed here. Disclaimer.
>> Subscribe to our posts.

Monday, September 24, 2012

TLT weekly, new trade sept/24/2012

TLT (30min, hourly, 4 hour, daily) charts


Looking at purely technical data, we think TLT was going sideways or higher because of the push from the last few days. Selling $121.5 weekly puts looks like a safe way to play TLT.

Trade:
Sell $121.5 weekly put
Buy $120 weekly put
(Got 30c credit)


*Please do your own research before buying any stock listed here. Disclaimer.
>> Subscribe to our posts.

Family Dollar Stores, Inc.(NYSE:FDO), new trade sept/24/2012


Trade update (Oct/19/2012):
Expired worhless for  100% of credit profit
________________________________________________________

I have been watching FDO for a long time now to break the downtrend. A lot of metrics are showing that FDO might start the run up again for atleast a few days and we wanted to get in it to atleast get a slow decaying premium on our side. If it continues we will start to get in something stronger on the vertical side. As seen in weekly chart, FDO is in clear uptrend. We have stop losses in place in case this goes against as our max loss is a lot more than max profit.

FDO daily chart

FDO weekly chart


Trade-:
Sell $62.5 Oct Put
Buy $62 Oct Put
(Get 55c credit)


*Please do your own research before buying any stock listed here. Disclaimer.
>> Subscribe to our posts.

Thursday, September 13, 2012

"We've lost control" - Ron Paul - Sep/13/2012

Paul argues on Bernanke's decision "We are creating money out of thin air" and "country should panic over Fed's decision". Embedded video below.


*Please do your own research before buying any stock listed here. Disclaimer.
>> Subscribe to our posts.

Akamai Technologies, Inc.(AKAM), new trade sept/13/2012

Trade update (Sep/22/2012):
Closed Trade-1 for 95c for 36% profit
Closed Trade-2 for the max profit of 31c for 45% profit
___________________________________________________

We see that AKAM has been in bullish territory for some time now so it has good chances the momentum will continue to the upside. After a few days of pullback it is now starting to make a move today and we added a few trades for moderate upside. If it continues the rally we may get something for strong upside too. Look for AKAM to close at the highs of the day to ride it through. We have stop losses in place in case this goes against.


Trade-1:
Buy $37 Sept Call - 1.36
Sell $38 Sept Call - 0.66
(Paid 70c)

Trade-2:
Sell $38 Sept Put - 0.5
Buy $37 Sept Put - 0.19
(Got 31c credit)


*Please do your own research before buying any stock listed here. Disclaimer.
>> Subscribe to our posts.

Tuesday, September 11, 2012

Facebook Inc, FB new trade sept/11/2012


Trade update (Sep/22/2012):
Closed this trade for $1.95 for approx. 70% profit
________________________________________________________


Our second trade in FB in just a few days. I wanted to do a weekly expiration but thought it's better to give it a few days time.

Trade:
Buy $18 Sept Call - 1.50
Sell $20 Sept Call - 0.35

I got this spread for $1.15. I believe the momentum on FB is to the upside now and if it continues for just a day or two more we make money with this spread. The only way we lose money here is if we go sharply lower right after we get in. I have a stop loss in place if it goes lower tomorrow, otherwise I ride it into next week.

*Please do your own research before buying any stock listed here. Disclaimer.
>> Subscribe to our posts.

Monday, September 10, 2012

GM vs FB, and new FB trade Sep/10/2012


Trade update (Sep/22/2012):
Both puts expired worthless giving us 55c for approx. 122% profit
________________________________________________________


GM's price today $22 (IPO high price was ~ $40)
FB's price today is $19 (IPO high price ~ $40)
Although the post-IPO results of Facebook have been similar to GM's, the FB debacle is considered horrendous while our president calls General Motors a success story. Related link.


Chartwise GM may look more attractive to the upside, I want to play FB to moderate upside on how it formed a kicker pattern a few days back and has held the previous lows. Although there are no guarantees, but I think it has formed an intermediate low and is trying to come out of oversold conditions. I have stop loss in place in case this goes against.


TRADE:
Sell 1 sep/22 $19 put
Buy 1 sep/22 $18 put
(Got a credit of 55c on Sep/5
)


*Please do your own research before buying any stock listed here. Disclaimer.
>> Subscribe to our posts.

Tuesday, August 14, 2012

Watch for a fakeout in SPX. Time to short again Aug/13/2012?

Watchout for a fake run up followed by a close like this (img below) to capture more pigs. High chances that this occurs just a few days before options expiration. I am looking for tue/wed for a reversal. Looking to get into a put spread going into 1380 for coming weeks.
SPX candle possibility going into tue/wed


VIX showing high levels of complacency?


Last time we saw VIX this low was in mid march after which markets started to wobble a bit and we got a nice correction. RUT and BANK index starting to show some weakness in images below.


*Please do your own research before buying any stock listed here. Disclaimer.
>> Subscribe to our posts.

Thursday, August 2, 2012

Cover your shorts Aug/02/2012 ?

Markets made a good move to the downside from our alert few days back LINK. This may be a time to cover shorts and take profits or to atleast cover some shorts. I covered a few shorts, mainly indices and went long into tomorrow at close today to hedge myself. These are the positions I will be closing during the day tomorrow or might keep until next week. I do believe there are chances that the markets will fall soon, but it just needs to breathe first. High TRIN reading of 2.19 suggests a possibility of short term bounce too.


SPX daily chart


*Please do your own research before buying any stock listed here. Disclaimer.
>> Subscribe to our posts.

Sunday, July 29, 2012

Go short July/29/2012 ?

Here's a similar chart as from last week mainly showing RSI resistance, and some possible weakness in coming days again. RSI is again approaching over 60, and I think there are some chances we retrace yet again from here, like we did last time (check old post). I am starting to get SPX spreads, but will initiate more in coming days if we start to curve downwards from this range. If we slow down and create a high base at these levels for atleast 2 days, I may start initiating some bullish positions for the coming weeks.
SPX showing possible RSI resistance


*Please do your own research before buying any stock listed here. Disclaimer.
>> Subscribe to our posts.

Thursday, July 19, 2012

Go short July/19/2012 ?

Here's a chart showing some possible weakness in coming days. RSI is again approaching over 60, and I think there are good chances we retrace again from here. I am starting to sell SPX spreads, buy VIX spreads and will initiate more short positions if we see any weakness in the markets starting today.
SPX daily chart (mainly RSI)


*Please do your own research before buying any stock listed here. Disclaimer.
>> Subscribe to our posts.

Monday, July 2, 2012

Boeing Co, BA trade for Jul/02/2011


The Boeing Company (BA)

Buy 1x (Aug $67.5 put)
Sell 1x (Aug $62.5 put)

Paid: $0.50
Google finance link

Looking to see how the stock behaves in the next few days before we decide to add more or close the position before the earnings.

*Please do your own research before buying any stock listed here. Disclaimer.
>> Subscribe to our posts.

Wednesday, June 20, 2012

SLV trade for June/20/2012

SLV july puts at $0.81

Bear flag breaking the trend


*Please do your own research before buying any stock listed here. Disclaimer.
>> Subscribe to our posts.

Monday, June 18, 2012

FB bear call spread trade for the week june/22/2012

FB just made a parabolic move to the upside and it may be starting a descent. Since the daily strength is to the upside and all major moving averages showing strength in FB, we didn't wanted to buy outright puts as we might get hit by decay. Instead, we initiated a bear call spread to collect premium if the stock stays below 31 for this week. We may also have some good time to close the position if the stock goes against us.

Trade:
Sell (1) 31 Calls
Buy (1) 32 Calls

5 min chart showing some weakness in the stock today and how it closed below 23.6 fib level.


Hourly chart shows weakness at close. Need confirmation.


Have a good day, trade smart and let us know your thoughts.

*Please do your own research before buying any stock listed here. Disclaimer.
>> Subscribe to our posts.

Tuesday, May 22, 2012

Bear Call Spreads for May/22/2012

Some trades we took today (all expiring this week):

AAPL (Sell 575, Buy 580)


AMZN Sell 220, Buy 225)


CF (Sell 165, Buy 170)
V (Sell 120, Buy 125)
GOOG (Sell 615, Buy 620)
 

*Please do your own research before buying any stock listed here.
>> Subscribe to our posts.